“How often is it cloudy in Pittsburgh? I wonder how many sunny days in Pittsburgh there are each year…”
A co-worker of mine innocently asked this back in 1997 as we sat in our office in Downtown Pittsburgh, as we watched the drizzle and fog outside of the window. I countered that, despite the current stretch of cloudy weather, Pittsburgh probably has more sunny days than we realize, and that it unfairly has a bad reputation. It seemed to me that the winter was much more miserable than the summer, and that people focus much more on the bad winters than the nicer summers. He disagreed.
I decided that I would keep track of the amount of sunshine that Pittsburgh received each day, on a scale of 1 to 5. One being dark & miserable (usually wet), and five being clear, or close to it, all day long. Along with it, I recorded the approximate high temperature of the day to the nearest 5 degrees. Both of these readings were based on my own observations only and were inherently subjective.
The recording of the Sunny Count began on 1/1/98 and quickly became a habit. Somehow I have continued it until the present day. As insane and awesomely nerdy as it is, there is now enough data to present some interesting findings. What follows below comes from 24 years of data, 1998 – 2021.
Sunshine / Cloudy Ratings
As described above, each day was assigned a rating of 1 to 5, based on observation. Here is a brief description of the ratings:
- Low clouds, usually rainy most of the day, miserable, noticeably dark.
- Standard Pittsburgh gray skies, not quite as dark, maybe a break of sun here or there.
- Partly sunny, a mixture of sun and clouds. Also, for days with changeable weather throughout the day.
- Nice weather, dry, bright but hazy, sunny but with clouds off & on, partly cloudy.
- Clear, blue skies, perhaps a few clouds around but generally very sunny.
I assigned the rating in an inherently subjective manner, but even more so because sometimes I would forget to do it for a few days and have to think back. So, not very scientific. However, over 24 years it is statistically significant how the wrinkles smooth out.
The following graph provides the average amount of Pittsburgh sunshine for each day of the year:
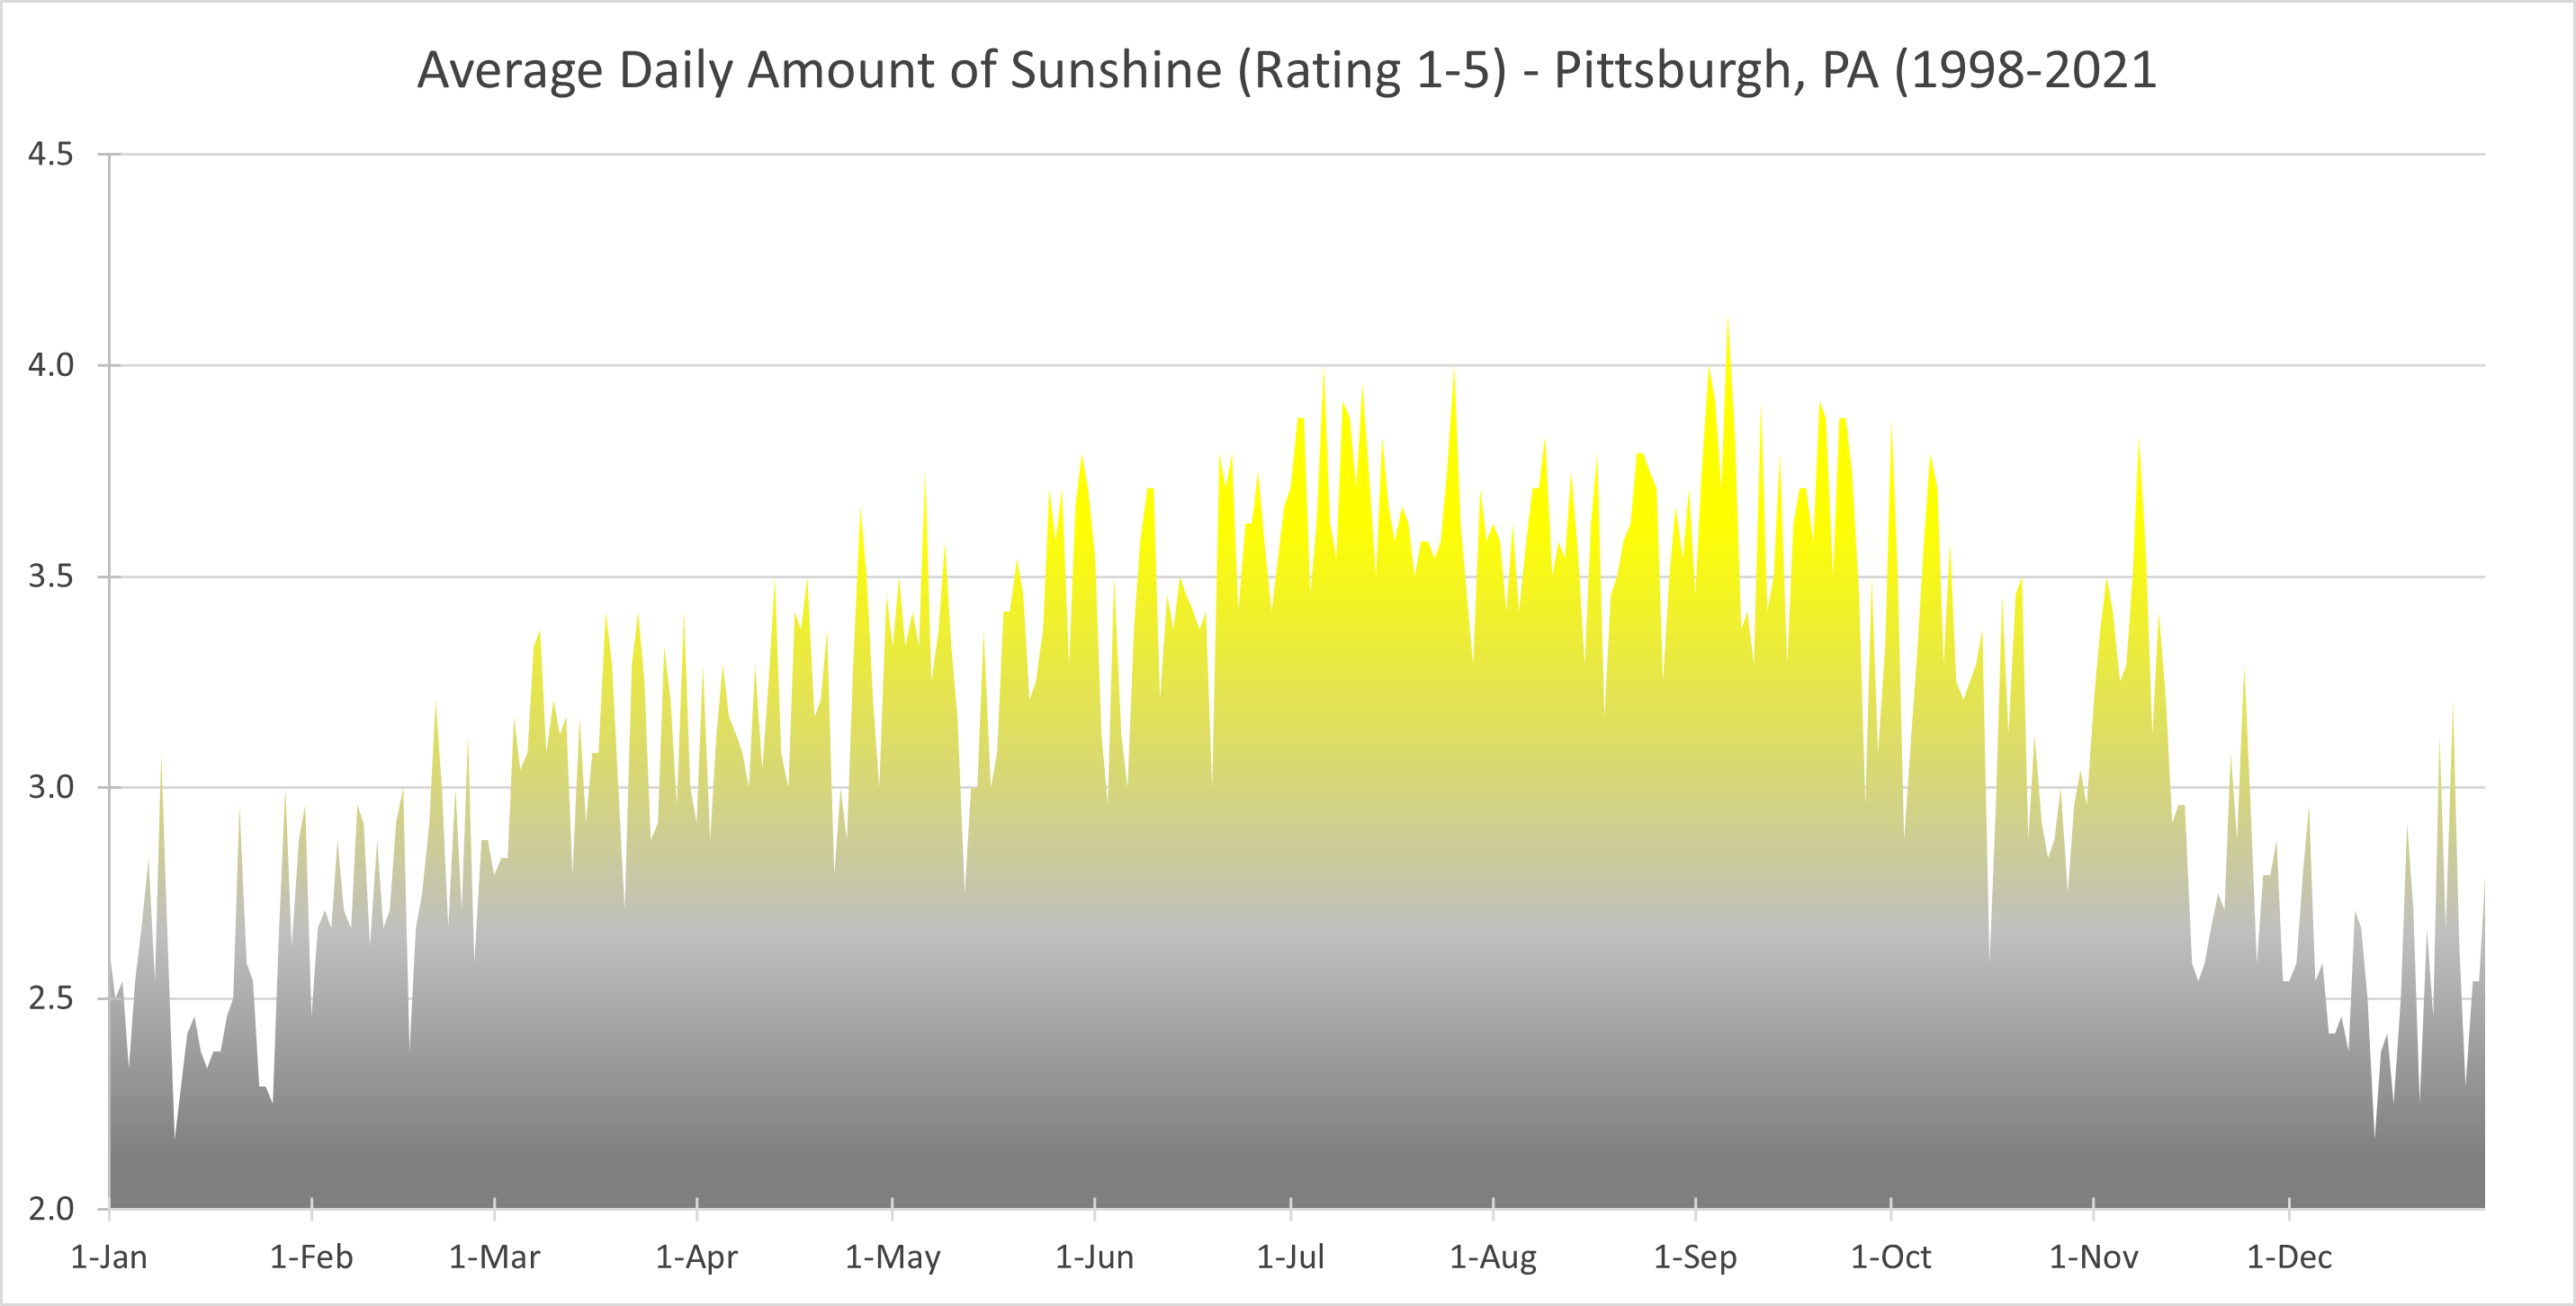
As expected, the summer months have the most sunshine, while the winter months are the darkest. The various peaks and valley are interesting and help to identify periodic weather patterns. For example, there is a return of nicer weather centered around the 9th or 10th of November, before the clouds return once again. Also, there appear to be cloudier / rainier periods each year in mid-May and early June.
The tables below provide the ten sunniest and cloudiest days in Pittsburgh, respectively:
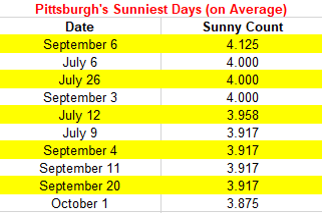
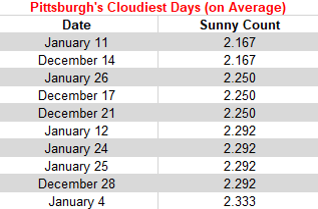
It is noteworthy that July and September contain the sunniest days (skipping August). The period around Labor Day seems to be the best bet for the best weather of the year. In contrast, the darkest days seem to be from mid-December through the end of January. The last week of January has three of the top ten cloudiest days of the year.
So, how sunny is it, on average, in Pittsburgh? 43% of the days over the 24-year period rated a four or a five. These primarily sunny days correlate well with the 160 sunny days per year in Pittsburgh that is cited here. Of them, only 16% scored a five, so clear days are relatively rare in Pittsburgh. 26% of the days rated a three; 22% rated a two. Finally, only 9% rated a one, which is reserved for the darkest of days. The average all-around rating was 3.184.
Temperature Data
Each day, along with the sunny count rating, I recorded the approximate high temperature to the nearest 5 degrees. Sometimes I knew the actual high temperature; usually it was a guesstimate based on what it felt like. However, over 24 years, much of the error should have cancelled out. While the overall curve is relatively smooth, it is interesting to still see significant temperature swing patterns throughout the year.
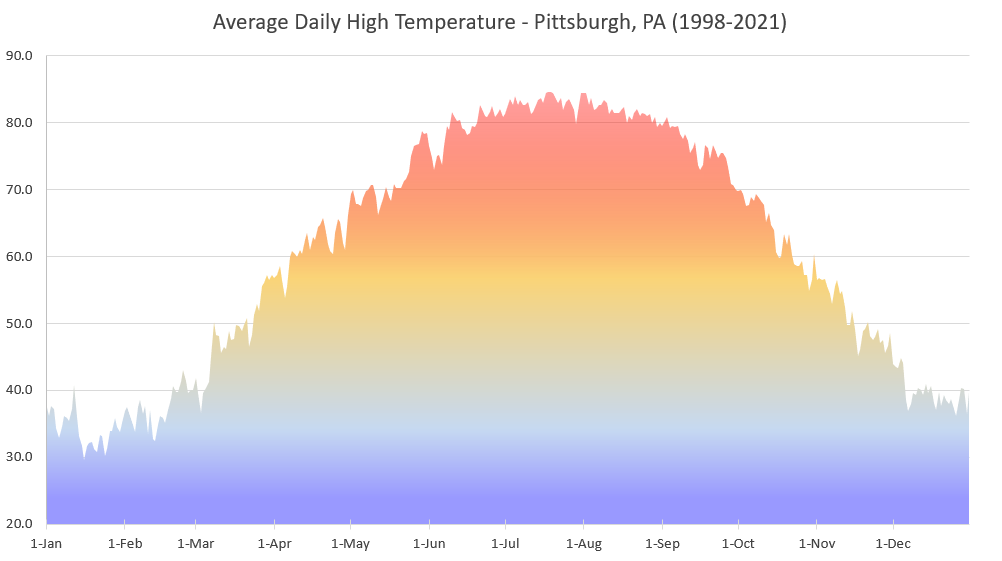
The coldest period in Pittsburgh appears to be in late January, while the warmest period is a bit longer, with high temperatures consistent from around the first day of summer on June 21st through August. The tables below provide the ten warmest and coldest days in Pittsburgh, respectively:
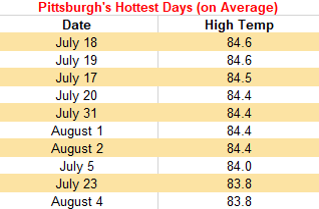
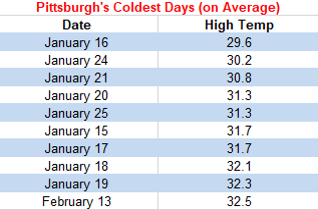
The warmest period in Pittsburgh appears to be from mid-July through the first few days of August. The coldest period is a bit narrower from around January 15 – 25. The maximum high temperature recorded during the 24-year Sunny Count period was 100 degrees on July 12, 2012 and the minimum was 0 degrees on January 7, 2014. The average overall high temperature was 60.7 degrees.


Leave a Reply